Quick answer
A food truck event profit calculator helps you compare sales, costs, fees, and downside risk.
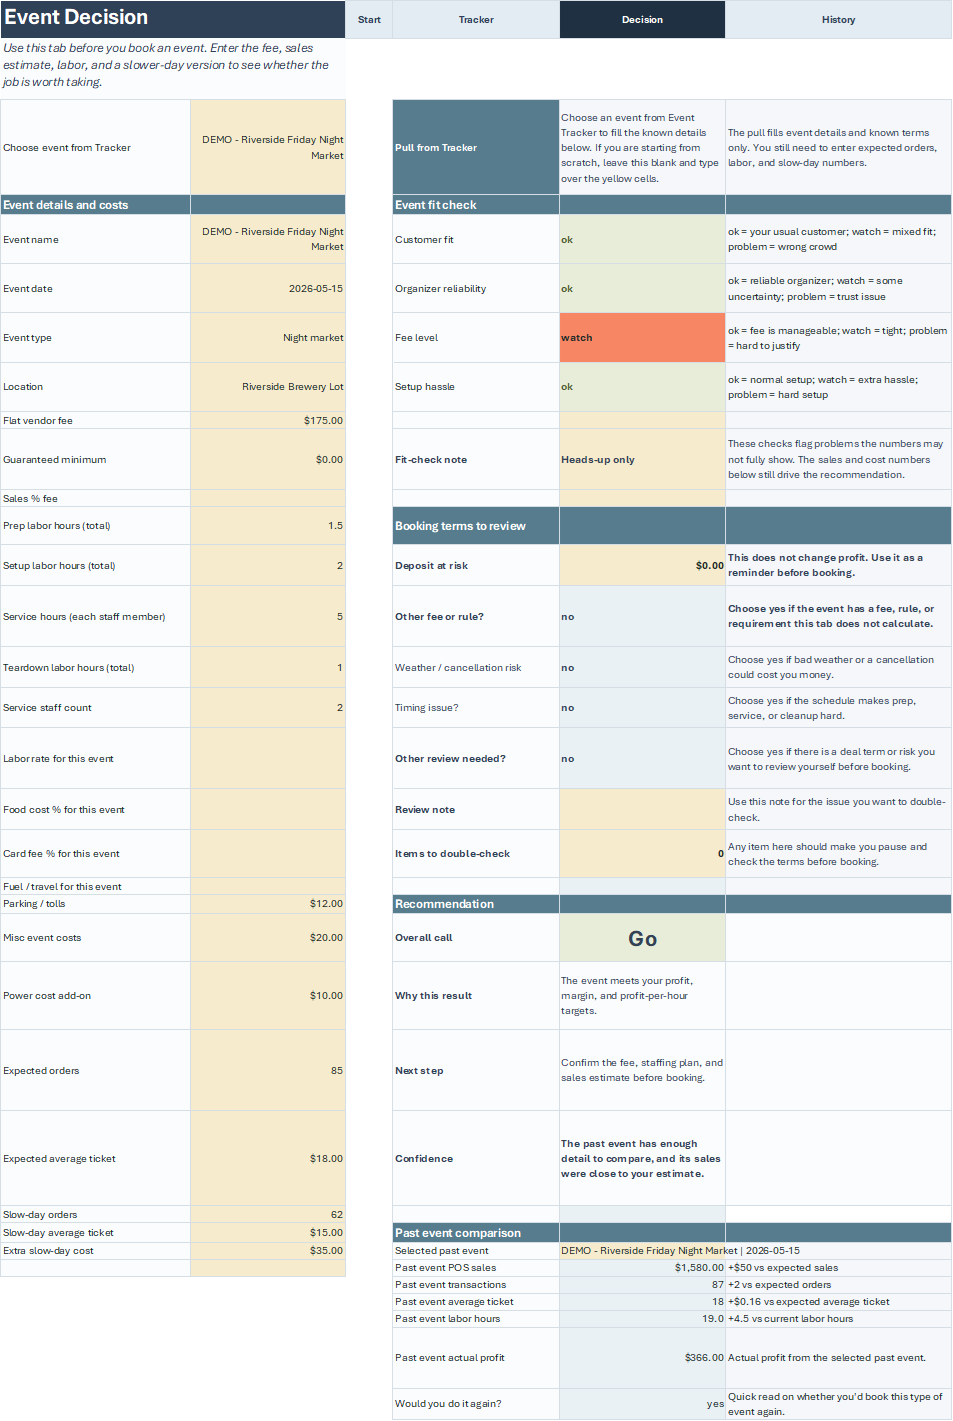
Use a food truck event profit calculator before paying a vendor fee or accepting a public event. The calculator should show expected sales, break-even sales, labor, food cost, travel, event fees, a downside case, and the notes you need for next time.
Event ROI
A busy food truck event is not always a profitable event
Food truck operators can have a long line and still come home with a weak result. A vendor fee, extra crew, long travel, slow load-in, poor placement, weather risk, or a menu that moves too slowly can eat up the margin that looked good from the sales number alone.
A food truck event profit calculator should help you look at the event before you commit the truck. The point is not to predict the future perfectly. The point is to see the sales you would need, the downside you can tolerate, and the details you should ask the organizer before you pay the fee.
Expected sales
Estimate revenue from realistic buyer count, average ticket, service speed, event length, and menu fit.
Event costs
Include food, packaging, prep, crew, travel, vendor fee, power, permits, lodging, and any event-specific purchases.
Downside case
Model what happens if attendance is lighter, weather turns, another similar vendor is added, or the service window is shorter than promised.
Actual results
After the event, record sales, costs, notes, weather, vendor count, and whether you would return under the same terms.
Break-even
The break-even math before you pay a vendor fee
The first number to find is not the organizer attendance estimate. It is the sales level you need after food cost, labor, travel, and fees. If the event has to sell far more meals than your truck can reasonably serve, the event is not fixed by optimism.
This is where an event profit calculator earns its keep. It turns the vendor packet into a decision: apply, negotiate, ask for better terms, or pass.
Contribution margin
Contribution margin = sales - variable food and packaging cost This shows what is left to cover labor, travel, fees, and profit after each sale.
Break-even sales
Break-even sales = fixed event costs / contribution margin percentage Use this to see how much you need to sell before the event stops losing money.
Target sales
Target sales = (fixed costs + target profit) / contribution margin percentage This gives you the sales number required for the event to be worth the date.
Estimated event profit
Estimated profit = sales - food cost - labor - travel - fees - other event costs Use the same formula after the event with actual numbers so your history improves.
Example
Example: a Saturday festival with a vendor fee
Say an organizer offers a Saturday festival spot with a $450 vendor fee, a six-hour service window, and an attendance estimate of 2,500 people. The packet sounds promising, but the question is how many of those people will actually buy from your truck.
If you expect $3,200 in sales with 34% food and packaging cost, $520 in crew cost, $120 in travel and fuel, and $80 in extra event supplies, the event looks like this before owner time and overhead.
| Line item | Example amount | What to check |
|---|---|---|
| Expected sales | $3,200 | Is this based on past vendor sales or only event attendance? |
| Food and packaging | $1,088 | At 34%, this leaves enough gross margin only if the sales estimate is realistic. |
| Crew labor | $520 | Include prep, travel, setup, service, breakdown, and cleanup time. |
| Vendor fee | $450 | Confirm whether the fee is refundable, weather-protected, or due before placement is assigned. |
| Travel and event costs | $200 | Fuel, parking, power, extra prep, supplies, and any permit or utility requirements. |
| Estimated event profit | $942 | This may be acceptable, but the downside case still matters. |
Now run the downside case. If sales fall to $2,100 because the crowd is spread out, two similar vendors are nearby, and the weather turns, food and packaging might drop to $714, but the fee, travel, and much of the labor stay fixed. The same event may fall close to break-even before owner time.
That is the difference between a sales estimate and an event decision. The event profit calculator should make that difference visible before the application deadline.
Inputs
Inputs to model before accepting the event
A useful event profit calculator does not need hundreds of fields. It needs the inputs that change the decision. If the organizer cannot answer basic questions about sales history, vendor count, placement, hours, power, weather terms, and refund rules, the calculator should make that uncertainty obvious.
| Input | Why it matters | Question to ask |
|---|---|---|
| Past food vendor sales | Attendance is not the same as buyers. | What did comparable food vendors sell at the last event? |
| Vendor count and overlap | Too many similar menus can split the crowd. | How many food vendors are accepted, and are categories limited? |
| Service window | Long hours add labor even if sales are concentrated. | When can we load in, start service, leave, and break down? |
| Power and setup | Generator rules, outlets, water, and trash can change costs. | What utilities are included and what do vendors provide? |
| Placement | Foot traffic and visibility can decide the event. | Where are trucks placed relative to seating, music, entrances, and alcohol? |
| Weather and refund terms | A nonrefundable fee changes the downside case. | What happens if weather, attendance, or event cancellation affects sales? |
Review
Track what happened so the next event decision gets easier
The best event profit data comes from your own truck. After the event, record the sales, food cost, labor, fee, weather, menu notes, line speed, placement, organizer communication, and whether you would return. A weak event can still be useful if it teaches you what to avoid next time.
Compare estimate to actual sales
Write down the estimate you used, the actual sales, and the reason for any gap you can identify.
Record the real labor load
Include prep, load-in, service, breakdown, cleaning, and admin time, not only the hours spent selling.
Note the event conditions
Weather, placement, vendor mix, music schedule, alcohol, seating, and organizer promotion all matter.
Decide what changes next time
Return as-is, negotiate the fee, require a better location, change the menu, or pass.
Capacity
Check whether the truck can actually hit the sales number
Some events fail the math even before the weather or vendor mix is considered. If the target sales number requires more orders per hour than the truck can serve, the opportunity is capped by capacity. A good event profit calculator should make that visible.
Start with the sales number you need, then translate it into orders. If the event requires $4,000 in sales at a $16 average ticket, that is 250 orders. Over a four-hour rush, the truck needs to average more than 60 orders per hour, not counting slow periods, payment delays, menu bottlenecks, or breaks in foot traffic.
Orders required
Orders required = target sales / average ticket Use this to see whether the sales target turns into a realistic order count.
Orders per hour
Orders per hour = orders required / active selling hours Compare this with what your crew can actually serve with the planned menu.
Capacity-capped sales
Max sales = realistic orders per hour x service hours x average ticket If max sales is below target sales, the event needs better terms or a different menu.
Fit
What the Event ROI Workbook does and does not do
The Event ROI Workbook is a decision and review tool. It helps compare food truck events, vendor fees, sales assumptions, costs, downside cases, and actual results. It is not a full accounting system, tax tool, inventory tracker, or POS report.
Use it before applying
Compare a vendor fee, expected sales, capacity, and downside case before committing the truck.
Use it after service
Record actual sales, costs, labor, notes, and whether the event deserves another try.
Keep POS reports separate
Use your POS for payment records and detailed sales reporting. Use the workbook for event-level review.
Keep accounting separate
Use your accounting process for taxes, payroll, inventory, and full business profit-and-loss reporting.
FAQ
Food Truck Event Profit Calculator for Vendor Fees and Event ROI FAQs
What should a food truck event profit calculator include?
A food truck event profit calculator should include expected sales, average ticket, food and packaging cost, labor, travel, vendor fee, setup costs, other event costs, downside sales, and actual results after the event.
How do I know if a food truck vendor fee is worth paying?
Compare the fee against realistic sales, contribution margin, labor, travel, setup, and downside risk. A fee can be worth paying if past vendor sales, placement, vendor count, and event terms support the sales required.
Is event profit the same as overall business profit?
No. Event profit looks at one event after event-specific sales and costs. Overall business profit also includes rent, insurance, commissary, payroll, debt, taxes, marketing, repairs, and other business expenses.
Should I include owner labor in the calculator?
Yes. Even if you do not pay yourself hourly for every event, owner time is still a real constraint. Counting it helps you compare one event against another use of the same truck and date.
Can a calculator guarantee an event will be profitable?
No. It can only model your assumptions. Weather, attendance, line speed, equipment issues, staffing, placement, and organizer decisions can still change the final result.
What should I track after a food truck event?
Track actual sales, food cost, labor, vendor fees, travel, weather, event hours, vendor count, placement, menu notes, sell-outs, waste, organizer communication, and whether you would return.